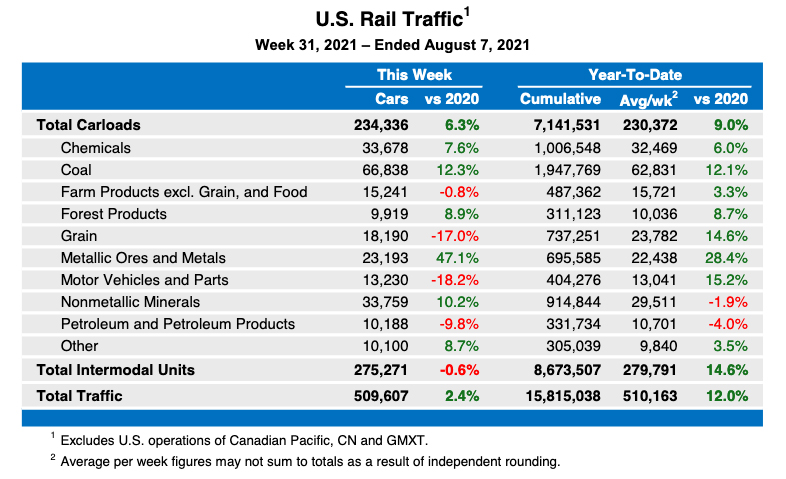
WASHINGTON — U.S. rail traffic for the week ending Aug. 7 offered mixed results compared to the same week in 2020, with carload traffic running ahead of 2020 figures while intermodal volume slipped slightly below 2020 levels.
Statistics from the Association of American Railroads show a total volume of 509,607 carloads and intermodal units, 2.4% ahead of the 2020 figure. This included 234,336 carloads, an increase of 6.3%, and 275,271 trailers and containers, a 0.6% decrease. The overall figure also represents a 1.4% increase over the week ending July 31, when railroads moved 502,540 carloads and intermodal units.
For the year to date, through 31 weeks, carload traffic is up 9% and intermodal traffic is up 14.6%. The total volume of 15,815,038 carloads and intermodal units is a 12% increase.
North American rail volume for the week, for 12 reporting U.S., Canadian, and Mexican railroads, included 325,978 carloads, a 4.1% increase over the same week in 2020; 358,442 intermodal unit, down 1.5%, and total traffic of 684,420 carloads and intermodal units, up 1.1%. In Canada, the 72,235 carloads represented a 2.1% increase, while the 68,578 intermodal units represented a 1% drop.