


WASHINGTON — U.S. rail traffic for the week ending April 16 showed steep declines in both carload and intermodal volume, according to the latest statistics from the Association of American Railroads.
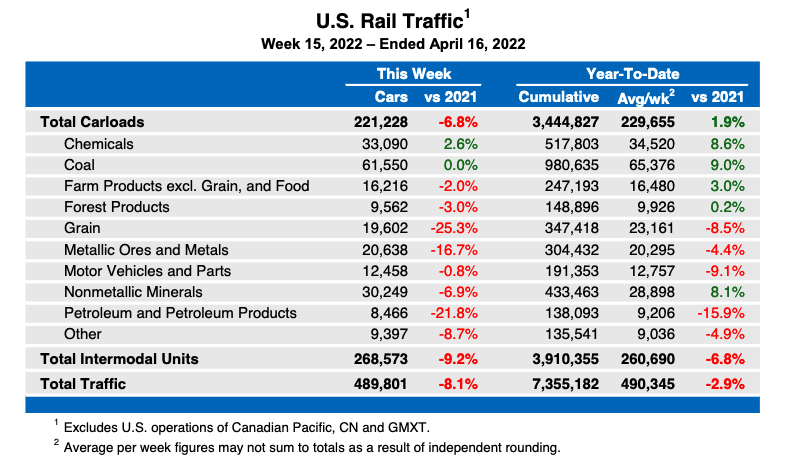
Overall traffic of 489,801 carloads and intermodal units represented an 8.1% drop from the corresponding week in 2021, with the 221,228 carloads — which have generally remained above previous-year figures — down 6.8%. Intermodal volume of 268,573 containers and trailers were down 9.2%.
This comes after overall traffic showed just a 1% decline the previous week. Easter’s later place in the calendar for 2022 compared to 2021 may have figured in the differences.
The week’s total was also below the year-to-date average of 490,345 carloads and intermodal units per week.
Year-to-date totals for the first 15 weeks of 2022 show carloads up 1.9% from the same point in 2021, while intermodal units are down 6.8% for an overall decline of 2.9%.
North American totals for 12 U.S., Canadian, and Mexican railroads include 319,064 carloads, a 6.8% decrease from the corresponding week in 2021, and 354,060 intermodal units, an 8.1% decline. The combined traffic of 673,124 carloads and intermodal units was down 7.5% The 15-week North American totals show overall traffic down 3.9%.


Weekly statistics are relatively meaningless. Year to date compared to 2021 is more meaningful. Better yet would be annual statistics for the previous twelve months compared to the same statistics for a prior period.
For the most part the narrative parrots the table. Unless the writer can add an insight that cannot be derived from the statistics, the writer should allow the statistics speak for themselves.
Agreed. What would also be informative is comparison with previous years, particularly pre pandemic.