This Map of the Month appeared in the January 2004 issue of Trains.
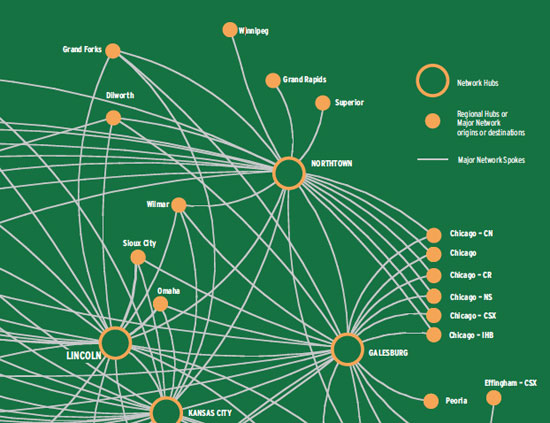
Al first glance, this looks like the route map of an airline. In reality, it’s BNSF Railway’s merchandise freight traffic network (i.e., cars not moving in unit trains from one common origin to one destination). It’s no coincidence they look the same, for both are hub-and-spoke systems that make it possible for any passenger or freight car to move between any two points. They share the same strength — low cost — and the same weakness — high vulnerability to missed connections and unhappy customers.
Some details have changed since BNSF developed this map in the late 1990s, but the routes and principles remain the same: Use a select number of high-capacity classification yards spaced strategically across the 33,000-mile system, and develop scheduled departures that will send a car to its final destination or an intermediate sorting location as inexpensively as possible.
BNSF has 10 strategic hubs, seven of which are automatic hump yards (the exceptions being Denver, Lincoln, Nebr., and Stockton, Calif.). BNSF in 2001 moved merchandise shipments (about 40 percent of its total carloads) between 13,400 origin-destination pairs, although 90 percent of those shipments moved between just 5,000 o-d pairs.
Hub-and-spoke systems make it possible for every car (or passenger) to travel between every point, optimizing the load capacity of the train (or airplane). But unlike airline passengers, who usually need to make only one connection, the average freight car will make several connections: four on Norfolk Southern, for instance. Each yard handling introduces the opportunity for a missed connection. Moreover, the huge number of railroad o-d pairs means that in many instances there will be only one train per day from a major yard to a destination, meaning that the average 12-hour dwell time in a yard becomes 36 hours each time a connection is missed.
Only recently have software programs been developed to model a carload network and project how one change might affect the whole. Still, there may be no better way to process thousands of freight cars, which is why railroads seek to shift traffic to unit or intermodal trains.
The alternative is to simplify the network. How? By raising rates on low-volume o-d pairs and forcing the business into high-volume pairs.
Railroads included in this map:
BNSF Railway, Canadian National, Conrail, CSX Transportation, Indiana Harbor Belt, Norfolk Southern