News & Reviews News Wire Class I average operating ratio inched upward in 2018 NEWSWIRE

Class I average operating ratio inched upward in 2018 NEWSWIRE

By Bill Stephens | February 27, 2019

| Last updated on November 3, 2020


Get a weekly roundup of the industry news you need.

Email Newsletter

Get the newest photos, videos, stories, and more from Trains.com brands. Sign-up for email today!

ClassIRailroadOperatingratioresults2018
Bill Stephens/ Class I railroad data
ClassIrailroadintermodalrevenuepercentage
Bill Stephens/ Class I railroad data
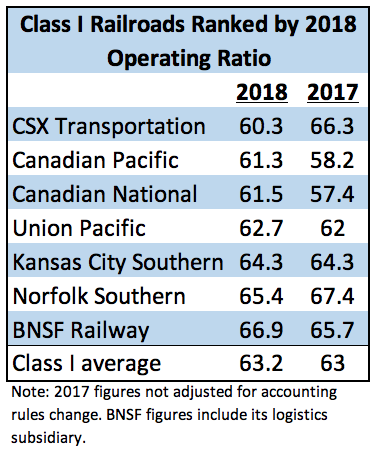
The Class I railroad average operating ratio rose slightly in 2018 — the first increase in a decade — as congestion-related costs and an accounting rules change pushed the closely watched efficiency metric up at four of the seven big systems.

CSX Transportation claimed the operating ratio crown, as expected, breaking Canadian National’s two-decade grip on the top spot.

CSX’s operating ratio was 60.3 percent, down from 66.3 percent in 2017, as the railroad continues to cut costs and increase revenue under the shift to Precision Scheduled Railroading that former CEO E. Hunter Harrison began in March 2017.

The only other railroad to produce an improved 2018 operating ratio, which measures costs as a percentage of revenue, was CSX’s eastern rival, Norfolk Southern. NS’s operating ratio was 65.4 percent, down two points from 2017.

BNSF Railway — the lone Class I railroad not adopting Harrison’s operating model — reported the highest operating ratio, 66.9 percent, up 1.2 points versus 2017 as its costs rose faster than revenue. The railroad does not make operating ratio a key metric, outgoing Executive Chairman Matt Rose has said.

Another reason BNSF’s operating ratio lags the pack: Traffic mix and the impact of lower-revenue intermodal business.

BNSF operates what’s by far the industry’s largest intermodal franchise. Some 35 percent of its revenue comes from its consumer products segment, which includes automotive traffic.

While 31 percent of UP’s revenue comes from its premium segment, which also includes automotive volume, the gap is actually wider than the numbers suggest due to the relative size of each railroad’s automotive business.

Automotive traffic was a shade under 5 percent of BNSF’s consumer products volume last year versus 11 percent of UP’s premium volume. On UP, automotive revenue per unit is roughly double that of an intermodal load.

The Canadian railroads, the first of the big systems Harrison led, have long boasted the industry’s lowest operating ratios.

But CN and Canadian Pacific both saw their operating ratios rise in 2018 due to an accounting-rules change that deals with the way certain pension assets and costs are treated. The pension obligations are far smaller for U.S. railroads because most workers are covered under the Railroad Retirement program, so the change had minimal impact on the U.S. Class I railroads.

CP’s operating ratio of 61.5 percent improved and was a company record when the 2017 operating ratio is adjusted to conform to the new accounting rules. But it was up 3.1 points on an unadjusted basis.

CN’s operating ratio rose to 61.5 percent, up from 59.8 percent on an adjusted basis, due to the rules change as well as the impact of the higher costs related to running a congested railroad in Western Canada, particularly in the first quarter of 2018.

CN wasn’t alone in the congestion department: Except for CSX, average train speeds on all of the Class I railroads declined last year.

Union Pacific’s operating ratio rose 0.7 points to 62.7 percent, largely due to the costs of running a less fluid railroad.

KCS’s operating ratio held steady at 64.3 percent as revenue growth matched the higher costs that sprang from congestion on its key cross-border route.

The Class I average operating ratio in 2018 stood at 63.2 percent, up 0.2 points from 2017. The last time the Class I average rose was in 2009 due to the impact of the Great Recession and the resulting steep decline in traffic.

The average operating ratio in 2009 was 76.1 percent, up from 75 percent a year earlier.

In a footnote to Canadian results, CN and CP would have had identical operating ratios if they both treated surplus land sales the same way, CN Chief Financial Officer Ghislain Houle told an investor conference last week.

CP includes land sales in its operating ratio calculation, while CN does not.

7 thoughts on “Class I average operating ratio inched upward in 2018 NEWSWIRE

  1. Stephen, funny how you are calling out the BNSF for their 1.2 percent increase, but somehow you feel the CN’s 4.1 percent increase didnt have an impact on the overall numbers since you neglected to mention them?

  2. It seems to me that if your OR is in the mid 60’s that needs to be shared with customers in the form of lower rates as you are in fact gouging the customers. When I was in trucking we were doing darned good to operate at a 92.

  3. Because traffic in general was up in 2018, is this an indicator that insufficient capacity for peaks due to traffic increases and bad weather could be solved with additional line and terminal capex and a surge fleet of rolling stock and crews?

  4. This is a long way from the bad old days of the late 60s and early 70s when the “professional iconoclast” John Kneiling was bemoaning operating ratios around 120 for the likes of Penn Central, Rock Island and the Milwaukee.

  5. HUNH!! The two railroads that caused average industry O.R. to increase: Canadian Pacific, and TRAINS poster-child, good ol’ BNSF railway. Now, ain’t that something, eh?

    (PS) I know UP’s inched up a bit (62.0 to 62.7) due to mostly bad weather late in 2018, but it was not enough to really affect the industry average.

You must login to submit a comment