


WASHINGTON — The weekly U.S. rail traffic figures from the Association of American Railroad are entering a period where year-to-year comparisons will be skewed because, at this point a year ago, the U.S. economy began to deal with widespread pandemic-related shutdowns, triggering significant reductions in rail traffic.
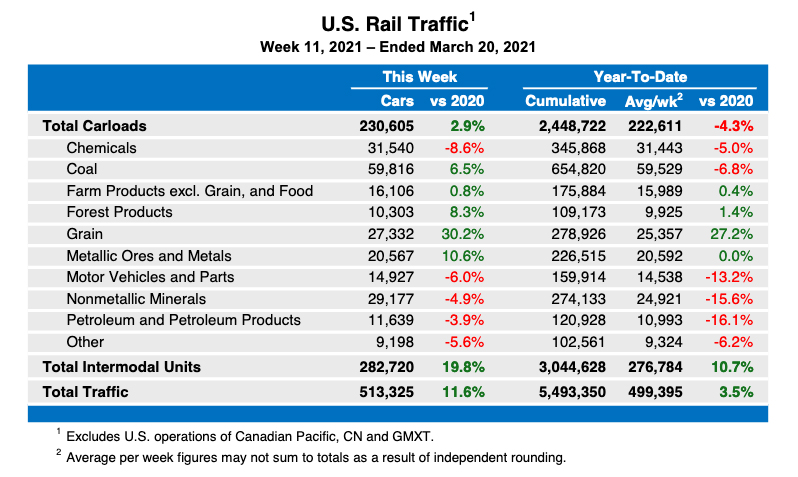
With that in mind, the figures for the week ending March 20 show an 11.6% increase in total traffic compared to the same week in 2020, with 230,605 carloads — an increase of 2.9% — and 282,720 trailers and containers, an increase of 19.8% in intermodal traffic. Five of 10 carload commodities showed increases, led by a 30.2% increase in grain. Through the first 11 weeks of the year, overall rail volume is up 3.5% compared to the same period a year ago, with intermodal traffic up 10.7% and carload traffic down 4.3%.
The North American totals — for 12 U.S., Canadian, and Mexican railroads — show 332,173 carloads, up 0.7% over the same week a year ago; 371,385 intermodal units, an increase of 18.8%, and overall volume of 703,558 carloads and intermodal units, up 9.5%. In Canada, railroads reported 81,088 carloads, down 3.6%, and 73,409 intermodal units, up 20.4%. Canada’s year-to-date totals are up 3.4% compared to 2020.


So, compare that weekly volume to 2019 then, that gives you a better comparison than to last years levels.