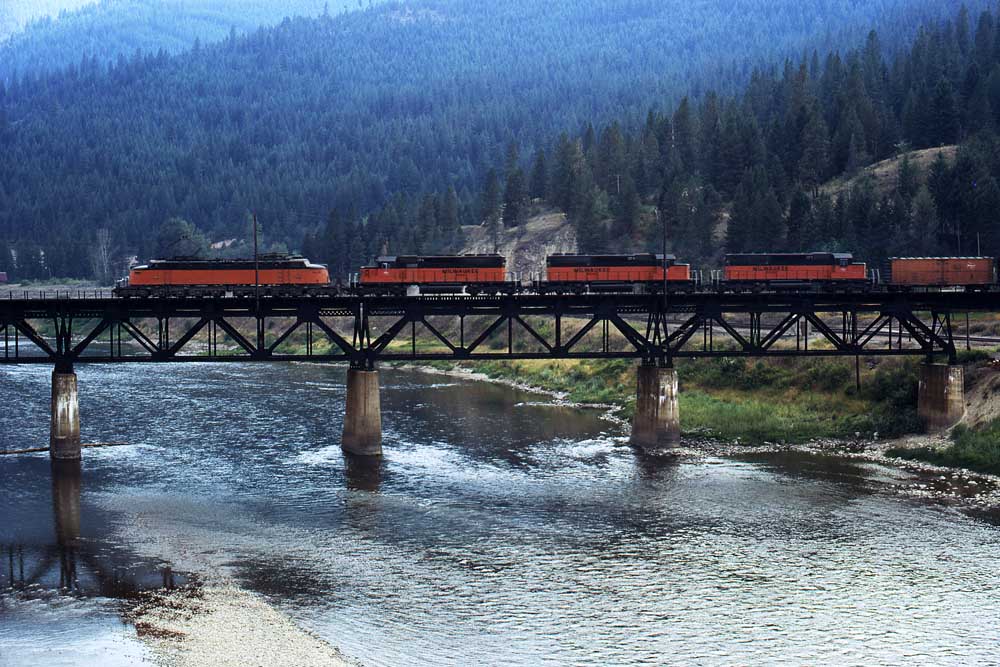
Clark Fork River Milwaukee Road tTrain 262 crosses high above the Clark Fork River at St. Regis, Mont., in August 1973 with a Little Joe leading three SD40-2s. Steve Schmollinger photo […]
Clark Fork River
We’ve refreshed our site! Check out our new look.

Clark Fork River Milwaukee Road tTrain 262 crosses high above the Clark Fork River at St. Regis, Mont., in August 1973 with a Little Joe leading three SD40-2s. Steve Schmollinger photo […]

LONDON — TCI Fund Management today released its plan to improve Canadian National’s operational and financial performance, saying that replacing CEO JJ Ruest with former CN Chief Operating Officer Jim Vena would usher in a new era of growth and profitability. But TCI’s plan, included with the launch of a website called cnbackontrack.com, sets no […]
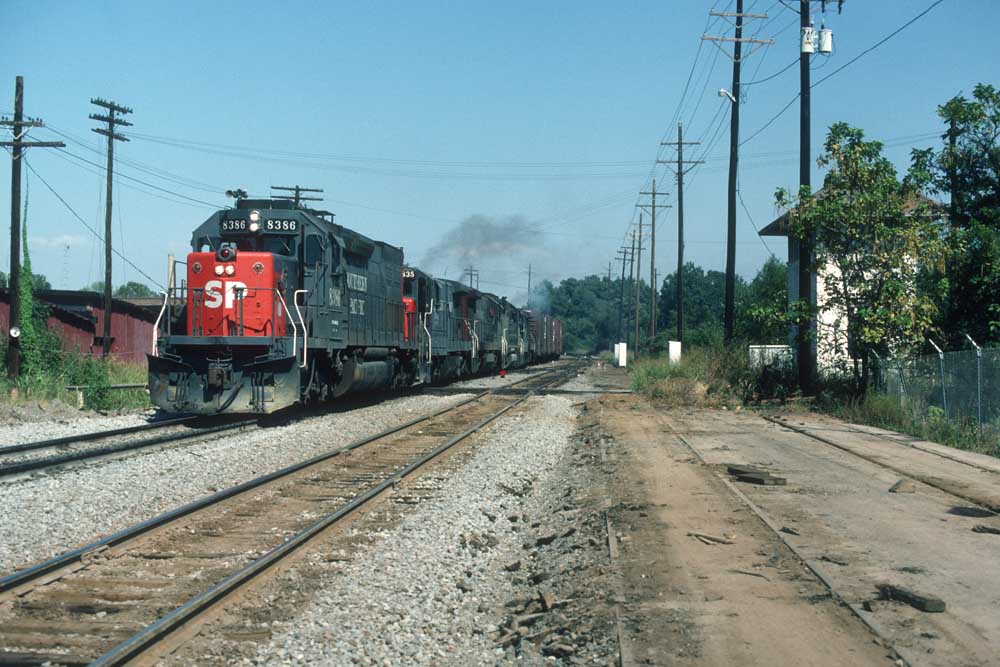
Texarkana train After a crew change, Southern Pacific SD40T-2 8386 leads train MFLAT out of Texarkana, Texas, on August 31, 1985. At the right is the interlocking tower that protects the Cotton Belt’s crossing with the KCS main line to Shreveport. Scott D. Lindsey photo […]
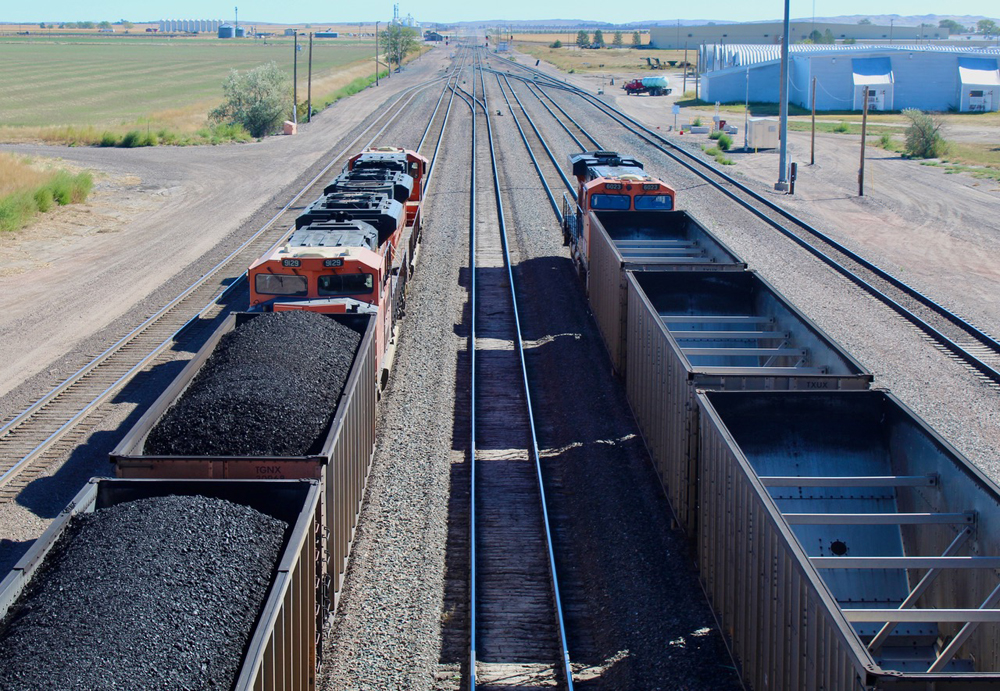
WASHINGTON – BNSF Railway will gain trackage rights over a short stretch of Union Pacific’s Jefferson City Subdivision in Missouri to begin serving a power plant 45 miles west of St. Louis. The 11.5 miles of trackage rights will allow BNSF to deliver coal trains from the Powder River Basin to Ameren’s power plant in Labadie, […]

JACKSONVILLE, Fla. — CSX Transportation has been honored by the Center for Climate and Energy Solutions and The Climate Registry for its efforts to reduce greenhouse gas emissions. The railroad has received a 2021 Climate Leadership Award for greenhouse gas reduction goal setting, recognizing ““exemplary corporate, organizational, and individual leadership in reducing carbon pollution and […]
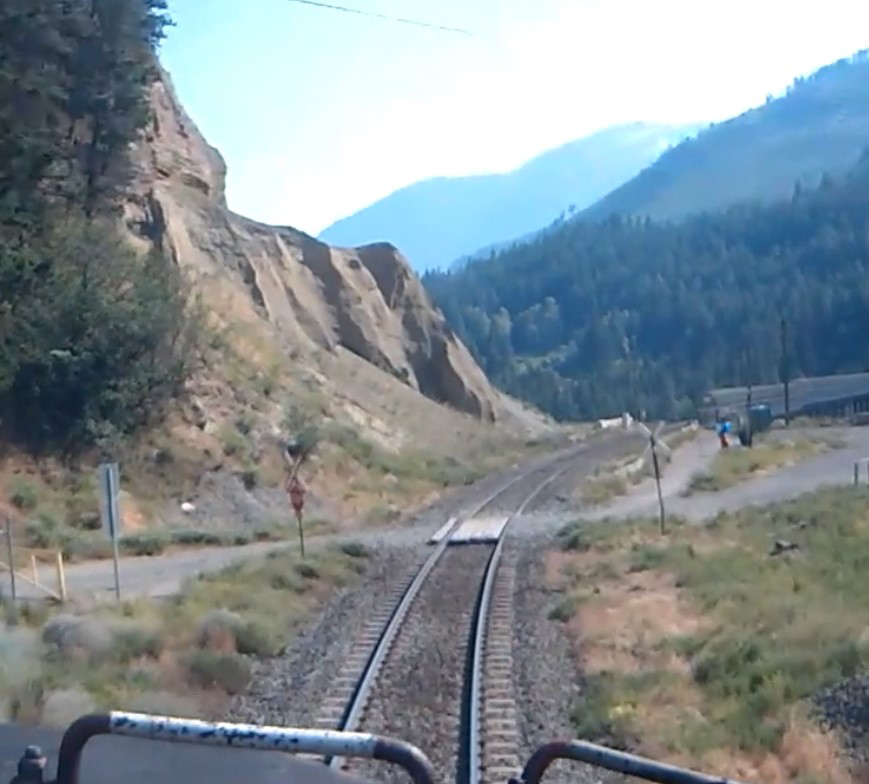
GATINEAU, Quebec — No evidence links railway operations to the fire that destroyed the town of Lytton, British Columbia, in June, the Transportation Safety Board of Canada said in a Thursday news release. This means the TSB’s role in the investigation is complete “unless new information establishes that a TSB reportable event occurred.” The fire […]
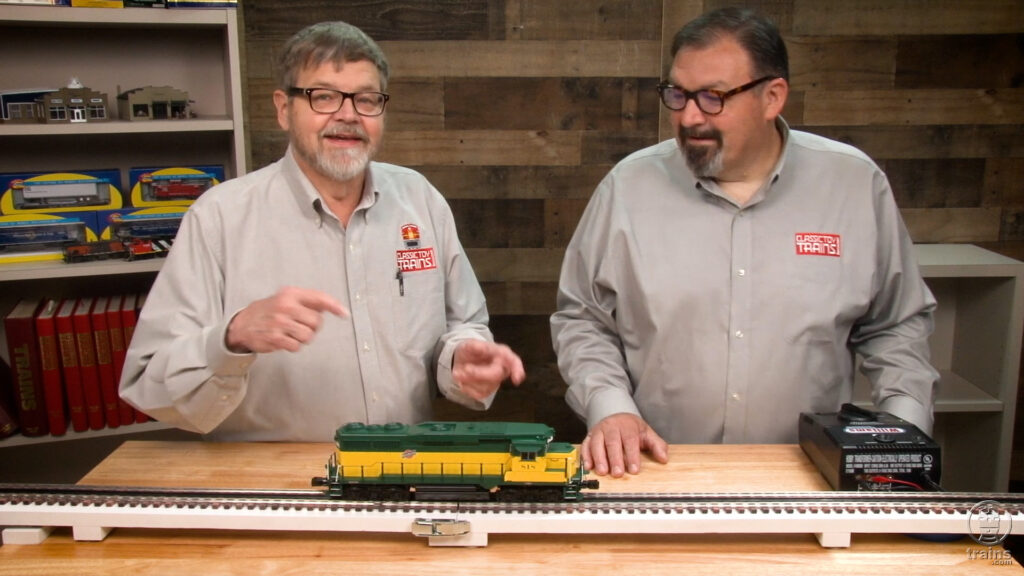
On this installment of Bob’s Train Box, Bob and CTT editor Hal Miller do a quick review of Lionel’s new Legacy GP30 (Read the full review in the December 2021 issue of CTT). Then Bob explains various track cleaning techniques and reveals his favorite thing to keep the rails shiny. The last stop is modern […]

On this installment of Bob’s Train Box, Bob and CTT editor Hal Miller do a quick review of Lionel’s new Legacy GP30 (Read the full review in the December 2021 issue of CTT). Then Bob explains various track cleaning techniques and reveals his favorite thing to keep the rails shiny. The last stop is modern […]
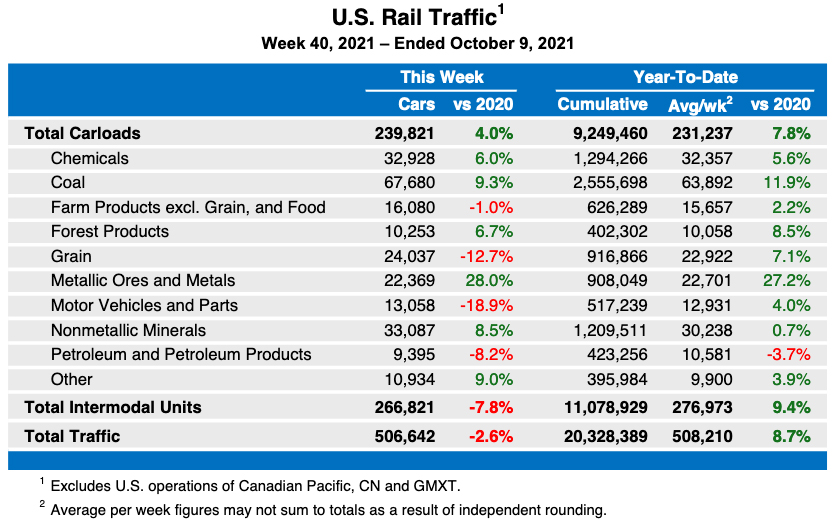
WASHINGTON — Intermodal issues reflecting broad supply-chain problems continue to drag down U.S. freight rail volume, according to the latest statistics from the Association of American Railroads. Figures for the week ending Oct. 9 found overall traffic down 2.6% against the same week in 2020. The total volume of 506,642 carloads and intermodal units included […]
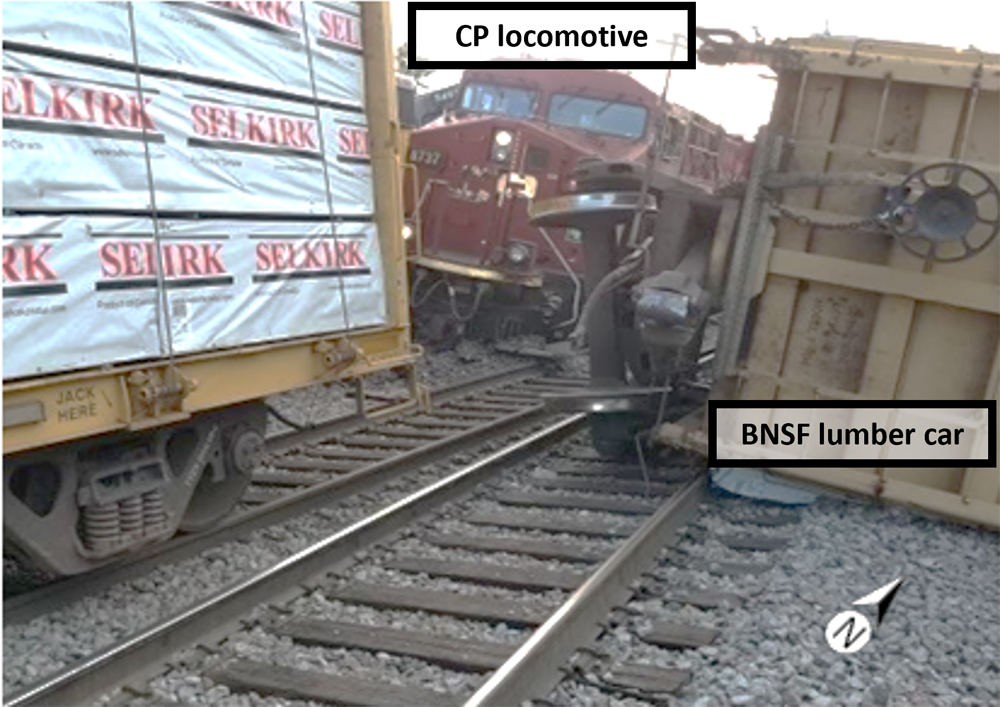
WASHINGTON — A Canadian Pacific train operating without functioning positive train control triggered August’s three-railroad, three-train collision in St. Paul, Minn., according to a preliminary report from the National Transportation Safety Board. The preliminary report, released Wednesday, lays out basic facts of the accident but does not draw any conclusions or recommend any actions. The […]
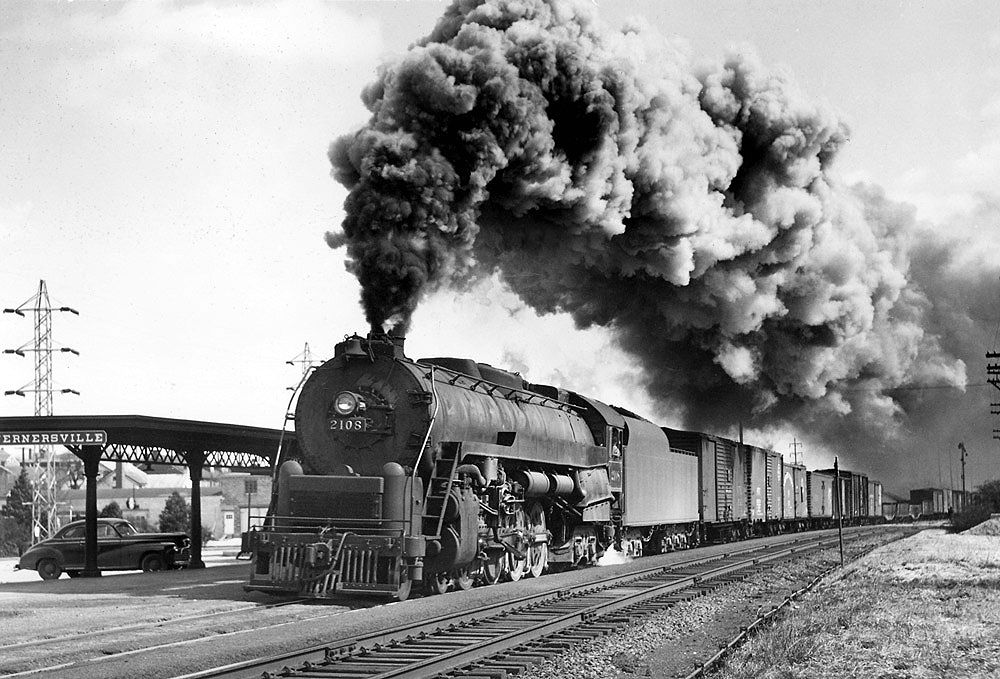
Reading Company freight trains are Classic Trains editors’ focus in this photo gallery. All through October, Classic Trains editors are celebrating the gritty, coal-hauling, Pennsylvania-based Reading Company railroad. Please enjoy this photo gallery of Reading freight trains selected from the image archives of Kalmbach Media‘s David P. Morgan Library. Reading Company, as a railroad, […]
KANSAS CITY, Mo. — Sameh Fahmy, Kansas City Southern’s executive vice president, precision scheduled railroading, will leave KCS by year’s end, the railroad has announced. Fahmy joined KCS in January 2019. Since then, the railroad says it has increased train velocity by 37%, decreasing freight car dwell by 18%, enacted double-digit reductions in equipment, and […]