


Canadian Pacific was the only Class I railroad to show volume growth in 2019.
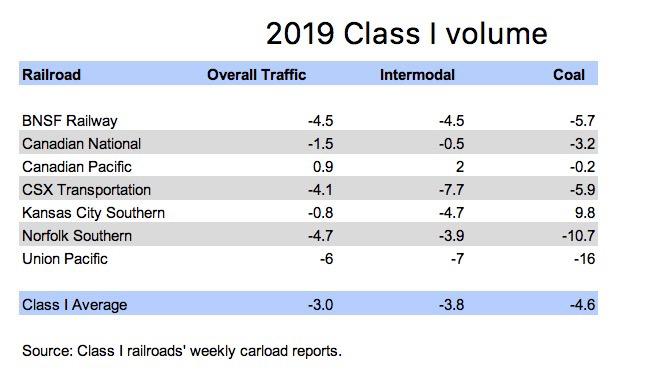
CP eked out 0.9% growth in total traffic, well above the industry average of a 3% decline in total volume measured by carloads and intermodal units, according to a Trains News Wire review of the railroads’ weekly carload reports.
CP also was the only railroad to show intermodal growth for the year thanks largely to international intermodal contract wins. Also contributing to CP’s gains: Energy, chemicals and plastics traffic, plus growth in forest products shipments.
Kansas City Southern’s traffic was down 0.8%, landing the smallest Class I in second place for the year.
Sitting in third place: Canadian National, with a decline of 1.5% in total traffic. CN’s intermodal volume fell 0.5%, while its coal volume was down 3.2%.
Union Pacific was the Class I cellar dweller. Its volume was down 6% overall thanks largely to a 16% plunge in coal and a 7% decline in intermodal volume.
UP’s rival in the West, BNSF Railway, saw its volume fall 4.5% for the year. BNSF’s intermodal volume was down 4.5%, while coal was down nearly 6%.
In the East, CSX Transportation’s 4.1% overall traffic decline bested Norfolk Southern’s 4.7% drop.
CSX’s intermodal volume was off 7.7%, while its coal volume fell nearly 6%. Much of the CSX intermodal volume decline was due to the intentional shedding of lower-margin traffic.
NS intermodal units were down nearly 4%, while its coal traffic dropped almost 11%.
The overall volume numbers are not as bad as they seem partly due to comparisons with an exceptionally robust 2018, according to analysts at the Association of American Railroads.
Coal sinking to record low volumes, lingering trade uncertainty, and a manufacturing slowdown were largely responsible for the rail traffic slump of 2019.
Intermodal volumes for the year were among the best on record and followed a record 2018. The AAR will report 2019 volumes later this week.


I remember reading that rail accounted to roughly 38% of all US tonnage handled a few years ago, but that was before the GFC and the major coal traffic drop of the late 2010’s. Removing coal from the equation, and the tonnage dropped to 22%. It’s probably worse now, as traditional rail-friendly sectors are on the wane, and hauls are becoming shorter. Railroads are phasing themselves out of relevance and out of existence by refusing to adapt to these inevitable changes.
Railroads traditionally have been the “canary in the coalmine” when it comes to the US economy. When rail traffic dropped, the economy slumped within a year. The traffic decline is what, 16 months old? And yet, the US economy continues to grow (slowly.)
Have we finally reached the point where railroads have made themselves irrelevant to the US economy?
Thomas Noye and Robert Hoover, it’s not 7% it’s 8% of all freight traffic in the U.S. is carried by railroads by dollar amount. Also, Thomas you have a commodity listed as low value merchandise when in reality it’s high value when it comes to the cost to transport it by rail…coal, it’s not cheap to move it by rail because it’s practically a captive commodity.
Michael Lampman: You pose an interesting question regarding freight railroads being a bellwether for the overall economy. Possibly the answer is “yes” the railroads are (or are becoming) irrelevant to the overall economy, given the decline of manufacturing in the United States and the shift to a service/high-value-tech economy whose output doesn’t necessarily lend itself to be being loaded into a box-car, a container, a tank-car, or a covered hopper car. Also, the railroads that are implementing “Precision-Scheduled Railroading” (PSR) (CN, CSX, CP, NS, and UP) seem to be happy to drive away more low-margin traffic than they bring in in new volume growth.
Robert Hoover: I am not familiar with the “7%” traffic figure you cite here (“…railroads carry 7% of all US traffic”). I suppose the answer to this question is “it depends” upon how you measure what railroads haul via what metric (tonnage, $$ value, carloads, etc.). That “7%” figure COULD be the total amount of traffic in the US by “value” (rather than gross tonnage). A figure that seems to stick in my head, is the railroads haul approximately 40% of all US freight in terms of overall “market-share” (gross tonnage market share?). As you know, railroads haul a lot of low value merchandise volume (coal, aggregates, grain etc.) as opposed to higher “value” freight (semiconductors, “Smart-Phones”, etc.).
I might be a bit off on this stat, but again it sticks in my head as a railroad “market share” figure in the overall economy.
I would be interested to hear any other thoughts or expertise on this question. Thanks.
Where amongst the blogs and columns and articles in Trains did I get a figure that’s been stuck in my head — that railroads carry 7% of all US traffic? Is that right??? Because that 7% number has been stuck in my head for a couple of months now and helps interpret what I’m seeing and reading. But where did that number come from?
Japan STILL WANTS COAL. The impact on farmers bankruptcies.