Across the U.S., cities have added and expanded public transportation, nearly tripling the number of rail transit systems over the past three decades. Since 1995, nearly 40 new commuter rail, light rail, and streetcar systems have debuted. Dedicated bus lanes, bike lanes, and bus rapid transit lines have proliferated as well.
So have new, alternate urban transportation modes. Just 10 years ago, Uber entered the scene. Lyft and many other ride-sharing startups soon followed. In 2013, Citi Bike placed 6,000 for-rent bicycles at stands in Manhattan and Brooklyn. More than 100,000 bikes are now available in cities across the U.S. In 2017, dockless electric scooters began showing up in San Francisco and can now be had in cities as disparate as Spokane, Wash., and Statesboro, Ga.
And yet, even as city commuters have seen their choices grow from the three-network days of ride, drive, or walk to an ever-growing lineup, it hasn’t gotten any easier to get around.
Traffic congestion cost the U.S. economy $87 billion last year, according to the World Economic Forum. Total vehicle miles traveled jumped 8.7 percent in the past 10 years. Pedestrian deaths are at their highest in three decades.
Meanwhile, it’s said that public transportation is losing riders at an alarming rate.
In the U.S. and around the world, urban transportation is evolving, changing, facing new challenges, and having to find new ways to move the ever-growing numbers of people in metropolitan areas. The future holds more disruptions: self-driving cars, microtransit, mobility as a service, hyperloop, electrification, automation, and perhaps other innovations as unknown now as Uber was in 2008.
In this five-part series, Trains sets out to explore these changes and how they affect rail transit — and how rail transit is adapting and thriving.
From 2014 to 2017, all passenger trips on U.S. public transit systems decreased 4.7 percent. In the same period, the Massachusetts Bay Transportation Authority (MBTA) saw a drop of 6.5 percent in total annual trips. New York City saw a loss of 3 percent of bus and subway riders, Chicago 6.8 percent. Los Angeles, which has been investing billions in new and expanded transit, saw ridership plummet more than 15 percent over the same period.
But those headline numbers are misleading. Over a longer timeframe, transit ridership is up: 30 percent since 1996, with annual passenger miles growing more than 40 percent. Rail ridership has increased 77 percent in that time.
Even for the downturn in recent years, those undifferentiated numbers tell a more nuanced story when they are pulled apart. In New York City, where bus travel declined 9.6 percent since 2014, subway ridership dipped just 1.3 percent. Chicago lost 9.7 percent of its bus riders but a lesser 3.3 percent of rail riders. LA Metro’s bus ridership sank more than 19 percent, while rail ridership wilted a mere 0.6 percent.
Buses are increasingly competing for road space with ride-hailing and internet delivery drivers, along with many more private vehicles. That causes delays and longer ride times, making buses less attractive to commuters.
New York’s Metropolitan Transportation Authority says it saw a dramatic increase in for-hire vehicle use in 2017 in an otherwise flat transportation environment. Translation: ride-hailing took market share from transit. A recent study from Transit Center, a New York-based pro-transit foundation, said that these transportation network companies are “nibbling away” at transit, mainly in dense cities such as New York, Boston, and Chicago.
But, warns Steven Higashide, a co-author of the study, “We can’t take our eye off the fact that the private automobile is still the main competitor in the transportation marketplace.”
More than 143 million new cars were sold in the U.S. from 2010 to 2018. Vehicle miles traveled reached a record last year. An online survey conducted as part of the Transit Center study revealed that 54 percent of people say they have full access to an automobile now, compared to 43 percent just two years ago.
Easy money has helped fuel robust car sales. In 2018 alone, auto buyers took on $144 billion in new loans. Subprime auto loans account for 22 percent of new loans, and more than 7 million Americans are at least 90 days late on their payments — more than at their peak in recession-era 2010.
“The population that is most likely to ride public transportation also saw the greatest gains in vehicle ownership, so we shouldn’t be surprised that after 2010 transit ridership started to fall,” explains Michael Manville, an urban planning professor at the University of California at Los Angeles.
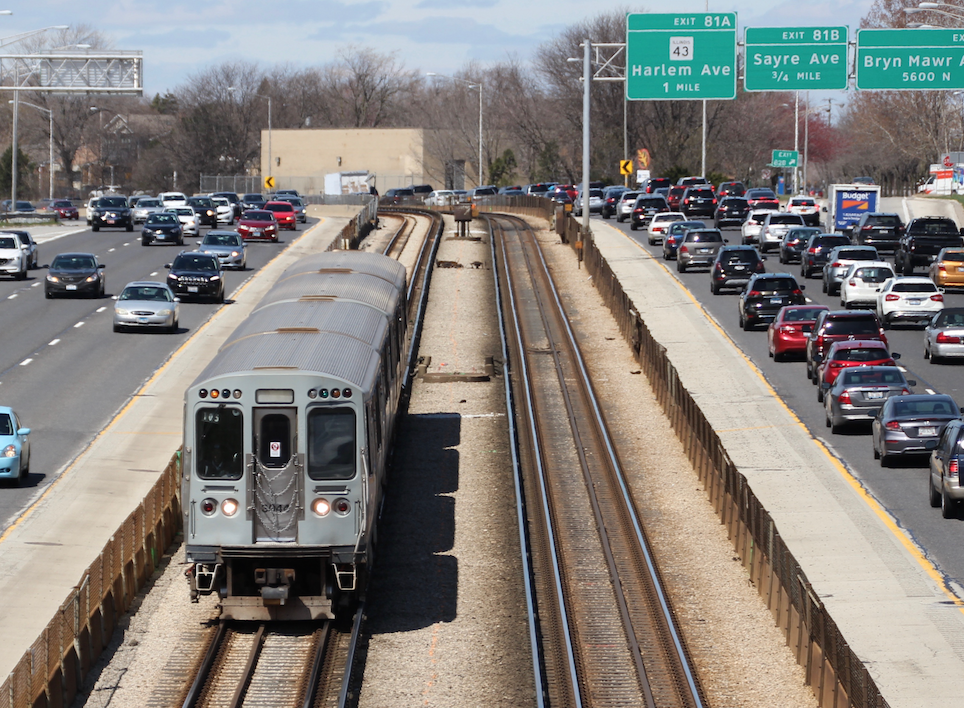
In New York City, motor vehicle registrations rose more than 4 percent from 2014 to 2016. Traffic crawls along at 9 miles per hour. It’s even slower in Boston, Washington, and Chicago. Traffic data company INRIX reports that U.S. drivers spend an average of 97 hours a year stuck in traffic.
Land use and financing policies favor car use, according to Transit Center. Even in dense urban cores, ample residential and business parking garages encourage driving. At all government levels, the bulk of transportation dollars go to roads and highways. Development sprawl runs counter to development that fosters transit use.
There are bright spots: cities that are bucking ridership declines and encouraging growth policies that sustain transit.
Transit ridership in Seattle reached a new high in 2018, with Sounder ridership up 4.5 percent and Link light rail up 6.1 percent. And the city accomplished something else that goes against the grain: cutting in half the percentage of commuters who drive solo into downtown.
One of the nation’s fastest growing regions, Seattle was able to start with a clean sheet of paper when voters approved a 1996 ballot measure to establish Sound Transit, fostering a mix of bus, light rail, and commuter rail lines.
Integration among modes and with other transit agencies in the area enables better connections for riders. Buses feed the higher-capacity, more efficient rail network. The ORCA card (“one regional card for all”) is accepted on seven transit systems, with discounts available for senior, youth, low income, and disabled riders.
Commute Seattle, a downtown business organization, encourages employers to offer the card as a worker perk.
“If you don’t start a conversation with people about their habits and routines, then no change is ever going to happen,” says Madeline Feig, the group’s transportation specialist.
Matt Shelden, deputy executive director of planning and innovation for Sound Transit, says they learned from other transit systems and from their own experience.
“Providing more service and providing high quality service tends to equal additional riders,” Shelden says.
The agency expects to soon add 37 new miles of light rail.
“We’re coming into a pretty transformative five-year period,” he says.
In Minneapolis, light rail ridership set a record in 2018, with its two lines carrying nearly 25 million riders. They now account for more than 30 percent of all Metro Transit’s users.
Denver’s light rail system grew ridership nearly 4 percent from 2013 to 2017. Its two-year old commuter-rail A Line has carried more than 20 million riders to date. But older systems are also showing how to grow ridership.
Los Angeles Metro provides an illuminating case study. Ridership on its two older lines — the Blue Line to Long Beach and the Green Line to Norwalk — saw losses greater than 25 percent from 2014 to 2018. Meanwhile, its two newest lines saw ridership growth.
The Gold Line, which opened in 2003 and was extended in 2009 and 2016, gained 13 percent more riders in the last four years, and the Expo Line, which started in 2012 and was extended to Santa Monica in 2016, saw ridership jump nearly 50 percent in that same period.
The Blue Line, often plagued by breakdowns, delays, and security concerns that deterred users, is now undergoing a major renovation to fix those issues.
Transit Center says the one factor that can either increase or discourage ridership is the quality of the service itself. They also found that personal safety ranks high as an area of concern for transit riders.
In a 2018 on-board survey of LA Metro rail users, 21 percent said they didn’t feel safe riding the train and 29 percent had experienced some form of sexual harassment. That’s something the agency is addressing with additional onboard police presence.
“It’s the fundamental aspects of the service that drive whether people use it,” says Transit Center’s Higashide. In Boston, where subway ridership dropped 5.2 percent from 2013 to 2017, the Massachusetts Bay Transportation Authority is spending $8 billion on 400 new subway cars, an extension to the Green Line, and upgrades to signal and power systems.
Convenience is also key. Transit riders are more likely to shift to driving or using ride-hailing services like Uber or Lyft on nights and weekends when trains and buses typically operate on reduced schedules, or not at all. Those are also times when roads are less crowded, favoring car travel.
The MBTA is exploring frequent, all-day commuter rail service as part of its Rail Vision study, due to be completed this year. That’s something many Metro North and Long Island Railroad riders have been used to for years, and that Toronto’s GO Transit is implementing.
Last year, the Ontario government increased scheduled runs 18 percent on the Lakeshore corridors and added rush-hour trains on the Kitchener line.
“It could be one of the most dramatic changes in the way we understand commuter rail in North America,” says transportation policy expert Yonah Freemark.
There’s no question that anyone wanting to get someplace today in an urban region has many more options than in the past. But these need to be put in perspective. Transit Center points out that in New York City, taxis and ride-hailing services combined account for just 3 percent of trips. Private vehicles handle 10 times as many, and rapid transit still commands a 31 percent share.
Transit holds a 13 percent share in Boston, 17 percent in San Francisco, and 12 percent in Chicago. Forty-four percent of Londoners choose transit, as do 35 percent of Berliners and 20 percent of Parisians.
Light rail, commuter rail, and heavy rail systems do what no other transportation mode can: move large numbers of people efficiently, safely, and with greater environmental benefits. Urban cores continue to draw more people and more jobs.
“There’s a much greater role for transit to make a comeback in today’s environment,” says Brittney Kohler, program director of transportation and infrastructure at the National League of Cities.
Both new and legacy transit systems find they can compete with the myriad of new options available to commuters. And increasingly, competition is becoming collaboration as agencies seek to make transit use more convenient and accessible to more riders.
The picture dated 2/21/2017 shows a Los Angeles Metro Subway car being received upon delivery at the Metro facility, NOT ” passengers boardeing a Metro Gold Line train”
I’m glad to see this. There are many issues dealing with transit and why the car and other modes are still major competitors. There is far more to be said than just this article, and I hope that future installments of this article will deal with them. Because I believe in rail and because I believe this issue is of vital importance, I have created a web site that is a collection of my thoughts on these issues. The focus of the web site is primarily on Hyperloop, however, there is a significant section dealing with general transit issues, primarily as it applies to Hyperloop. At the risk of violating any terms of service, I am going to post the link to this anyway because I think this issue is important.
http://www.ensingers.com/Bill222E/vacuumtubetravel.shtml#