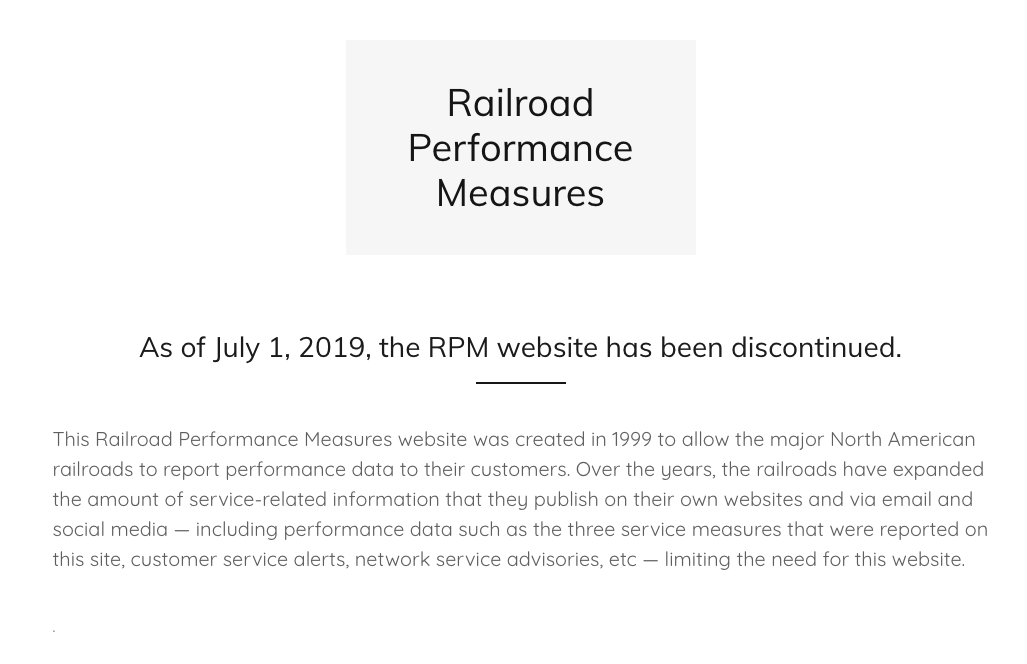
The railroadpm.org website — which reported weekly Class I figures for terminal dwell, average train speed, and cars online — was an outgrowth of the widespread service problems that accompanied the Class I railroad megamergers of the 1990s.
“This Railroad Performance Measures website was created in 1999 to allow the major North American railroads to report performance data to their customers,” the AAR says in a notice on the site. “Over the years, the railroads have expanded the amount of service-related information that they publish on their own websites and via email and social media — including performance data such as the three service measures that were reported on this site, customer service alerts, network service advisories, etc. — limiting the need for this website.”
Canadian Pacific and CSX Transportation stopped participating in the voluntary website after they changed their metrics to a non-standard methodology under former CEO E. Hunter Harrison. Both railroads, along with CN, report weekly performance data in their own formats on their respective websites.
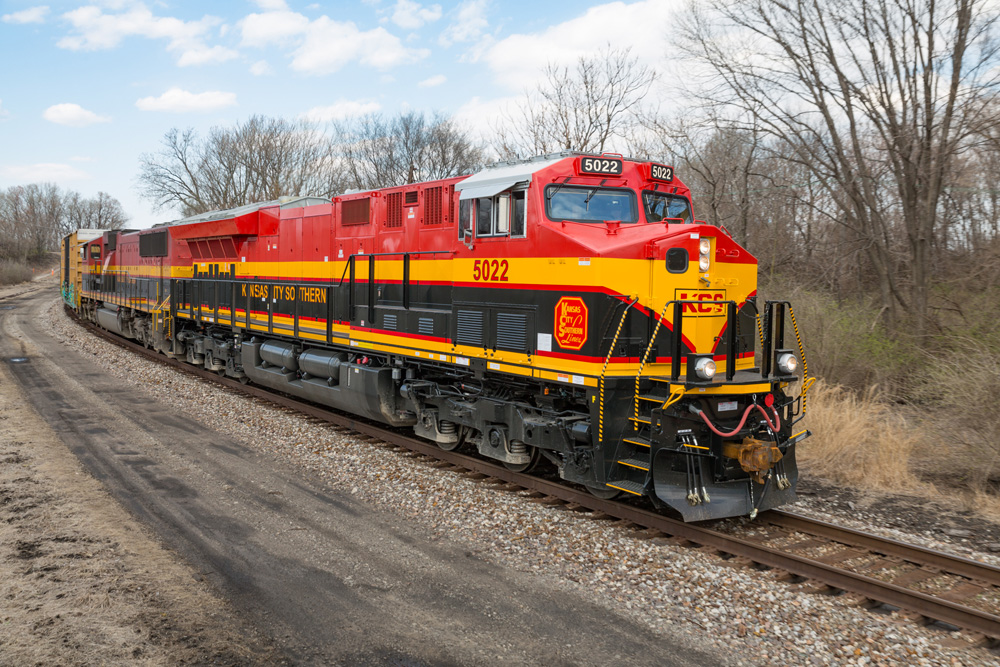
Kansas City Southern and Union Pacific report weekly AAR-standard data on their websites. Norfolk Southern has begun providing monthly performance data on its website, while BNSF Railway provides detailed network updates every other week.
All of the Class I systems still provide AAR-standard performance metrics to the Surface Transportation Board on a weekly basis under an order dating to the service problems that began during the harsh winter of 2013 to 2014. Those reports, along with data going back to 2014, are available on the STB website.
The demise of the user-friendly Railroad Performance Measures site makes it more difficult for shippers to gather rail performance data.
“It does make it harder on shippers and other industry participants to be able to compare how carriers are doing,” says Todd Tranausky, a rail analyst with FTR Transportation Intelligence. “With each carrier adapting its own methodology, you can only really compare the carrier to itself over time and not to other carriers. It also puts the onus on shippers to pull the data from the STB’s website, and to reconfigure existing systems they had in place to easily pull the data off the RPM website to point to the STB’s spreadsheets and formatting. I think shippers care from the standpoint of it making it harder to have transparency into how carriers are doing and performing. The more sophisticated shippers will find the STB data and update their systems accordingly, but the smaller shippers will be turned off by it as one more example of carriers not wanting to be open and work with them on service performance.”
Shippers and regulators view the performance measures as a way to monitor the health of the rail network as a whole as well as of individual railroads. When train speeds decline and terminal dwell rises over a period of weeks, it’s typically a red flag that there’s congestion and related service problems.
Some shippers have been seeking more data. The American Chemistry Council, for example, has asked federal regulators to require the Class I systems to provide additional detail on shipments interchanged at Chicago, the continent’s busiest rail gateway.
The Chemistry Council, which represents chemical producers, doesn’t have a position on the demise of the Railroad Performance Measures website, spokesman Scott Jensen says.
“We do strongly support the STB’s existing requirements for uniform performance reporting by railroads,” Jensen says. “Especially in the light of the serious ongoing service issues, we encourage the board to look for ways to enhance this program and ensure it provides meaningful and usable information on railroad service performance.”


