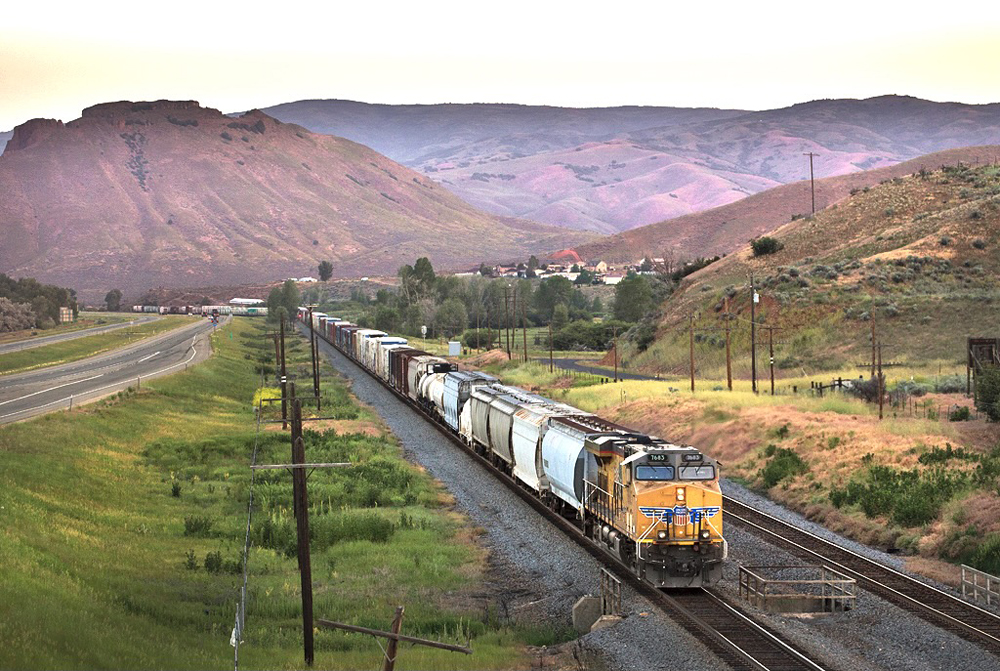
CHARLESTON, W.Va. — Railroads measure key operating metrics through railcar velocities. Class I railroads gauge operating performance by how many miles a railcar travels in a day on its network, the average speed of regularly scheduled trains, and average terminal dwell times, among other metrics. It shares this data publicly with investors, shippers, and regulators. Car velocity is one element of a set of metrics that illustrates the operating performance of a Class I railroad and provide a systemwide snapshot of the overall state of the railroad.
Railroad freight shippers also pay attention to railcar velocity and have a unique frontline exposure to pinch points across America’s rail network. Longer route miles aren’t a nuisance as much as knowing what could happen at a railcar’s next hand-off location. Getting through a small transfer yard may be more difficult than releasing a railcar in Los Angeles and tracking it until it arrives in Dallas days later.
Each customer has its unique list of origin and destination pairs used to ship and receive its commodity. Customers use thousands of these freight patterns to route their freight to various end-users and destinations. As railroads focus on bettering its operating performance, customers are focused on the entire route, keeping tabs on standard offenders and being cognizant of troubling new outliers.
Larger rail customers have more visibility on what’s happening on different railroads, and this helps them make educated guesses on decisions like using truck or rail.
Let’s put ourselves at the keyboard of a fictitious customer obligated to send 1,500 carloads using 125 railcars it owns specifically for this purpose. And let’s say it takes 12 days to reach its destination. That’s a minimum of 24 round-trip days without factoring how long it takes to arrive to the rail spur after reaching the destination city, plus considering the time it takes to offload the product. Let’s assume 30 full days to successfully complete the rotation.
You will need to ship exactly all 125 railcars, every 30 days to meet your obligation. Your 125-car asset will be able to complete 12 cycles per calendar year and achieve 1,500 carloads. But what if you miscalculated those velocities and you need to add two days of transit time, plus another day of terminal dwell because you misjudged how long it takes to complete an interchange? You have suddenly added 6 days to your cycle, creating a 36-day rotation. The same 125-car asset will now only complete 10 cycles per calendar year and achieve 1,250 carloads, a deficit of 250 carloads.
So, what if you adjusted your calculations, but an uncontrollable set of circumstances on a railroad has now tacked on additional days? Do you now add to your railcar fleet to offset the deficit? There are many variables you could add to the scenario to underpin that one remedy is not a cure-all.
You can begin to realize the importance of understanding railcar velocity, and the overall business, from the perspective of the railroad customer in an environment where, as the shipper, you can’t control parts of the situation. It can be overwhelming and frustrating.
Shipping freight by rail can be complicated even for those of us who understand how things work. Factoring in wild cards and challenges in moving heavy volume through interchanges, cities, and locations plagued with a laundry list of hindrances makes it more complicated.
Railroads will continue to prioritize velocity to measure efficiency even as how they do so evolves. Open-mindedness in all aspects of the business will help challenge old practices and introduce new ideas through trial and error.
If customers can get involved with feedback on what they believe is and isn’t effective, that discussion should help benefit all stakeholders. Railroads want to move freight cars, just as customers do. This isn’t two vastly different groups seeking common ground on different priorities.
Communication, transparency, embracing ideas, and using more technology are just a few of the mechanisms that can bring the two groups closer together with the common goal of improving freight rail service, and therefore, velocity.
Getting customers educated on railroading’s complexities is just as important as putting a railroader into the shoes of the shipper. We have to understand one another and work together effectively, so that if one of us wins, we both share in the victory. At end of the day, our priorities should be aligned, because we all want the same thing — getting railcars where they need to go.
Chase Gunnoe works in marketing and sales for the freight rail industry and is the author of Carload Considerations, a monthly Trains News Wire commentary series. It discusses the freight rail industry, commodities, and economic trends. Its views are the opinion of its author with no particular emphasis on a specific railroad or shipper.


Back in passenger days, PRR, B&O and NYC could run NY or Wash-Chicago and back with two consists for their Blue Ribbon trains. Erie and DL&W-NKP and later, EL, could not and required three consists.
Chicago-West Coast usually required five consists except the San Francisco Chief which required six.
So this is nothing new.
A telling metric was the story yesterday about CN wanting to get back to basics…they want to get daily mileage back up to 210 miles per day per car…that’s less than 10 miles per hour for the average car…pathetic.
Regarding average car velocity… an “Average” is a useful metric for a symmetric probability distribution. Do car velocites follow a normal probability distribution (i.e., a bell-shaped curve)? I have never seen or worked with such data, but I doubt velocity is normally distributed. The standard deviation (the spread of the data) could be useful, in any event.
An anecdote about averages: The patient’s feet are in the fire and head is in the freezer, but his temperature is 98.6F.
The median or deciles of velocity are probably more meaningful. For instance, what is the velocity of 75% or 90% of cars? Or the bottom quartile? How bad is bad?
Lastly, I worked with numerous industries as an employee and consultant. Let it suffice to say, they all play games with data, to make their manure look like candy. Who audits the RAW velocity data, before any data “cooking” can take place? What are allowable exclusions, and are the separately reported with excuse explanations? Does the STB or FRA or any independent entity ever have look at the RAW data? Or big 4 auditors? I doubt that very much.
Thanks Chase. The specific example you gave was very enlightening to those of us not in the business.
Great article. My experience is that consistency in all facets of the shipper/carrier contract transaction results in a quality, value, and service formula that will maintain and grow carload business via the rails. Consistency.