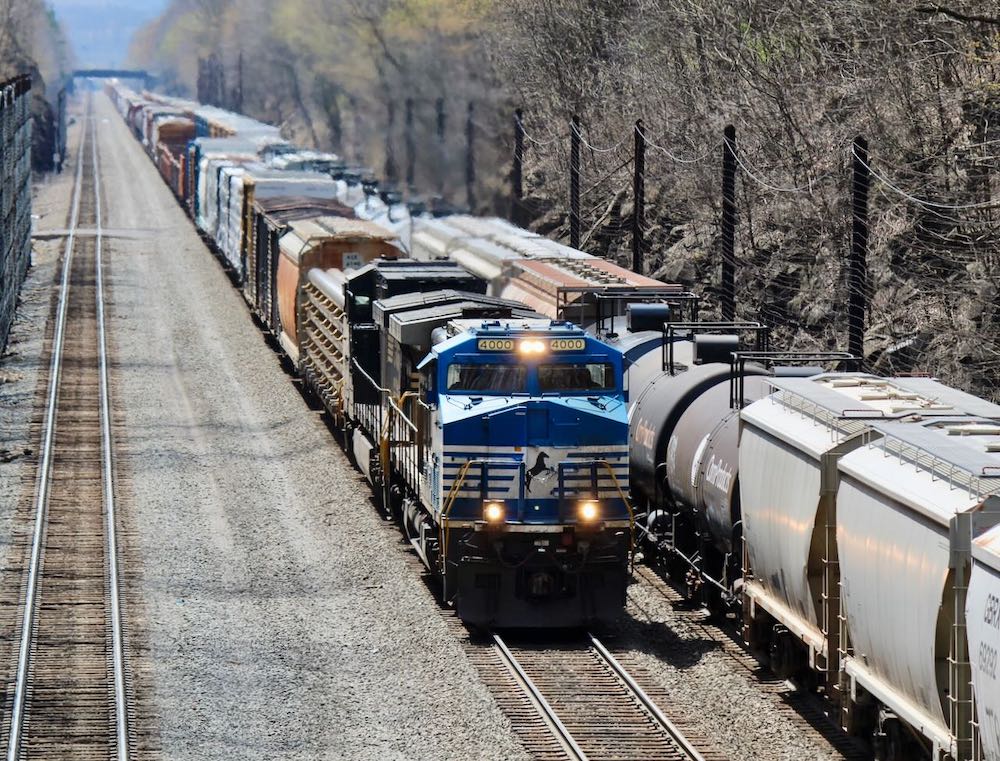
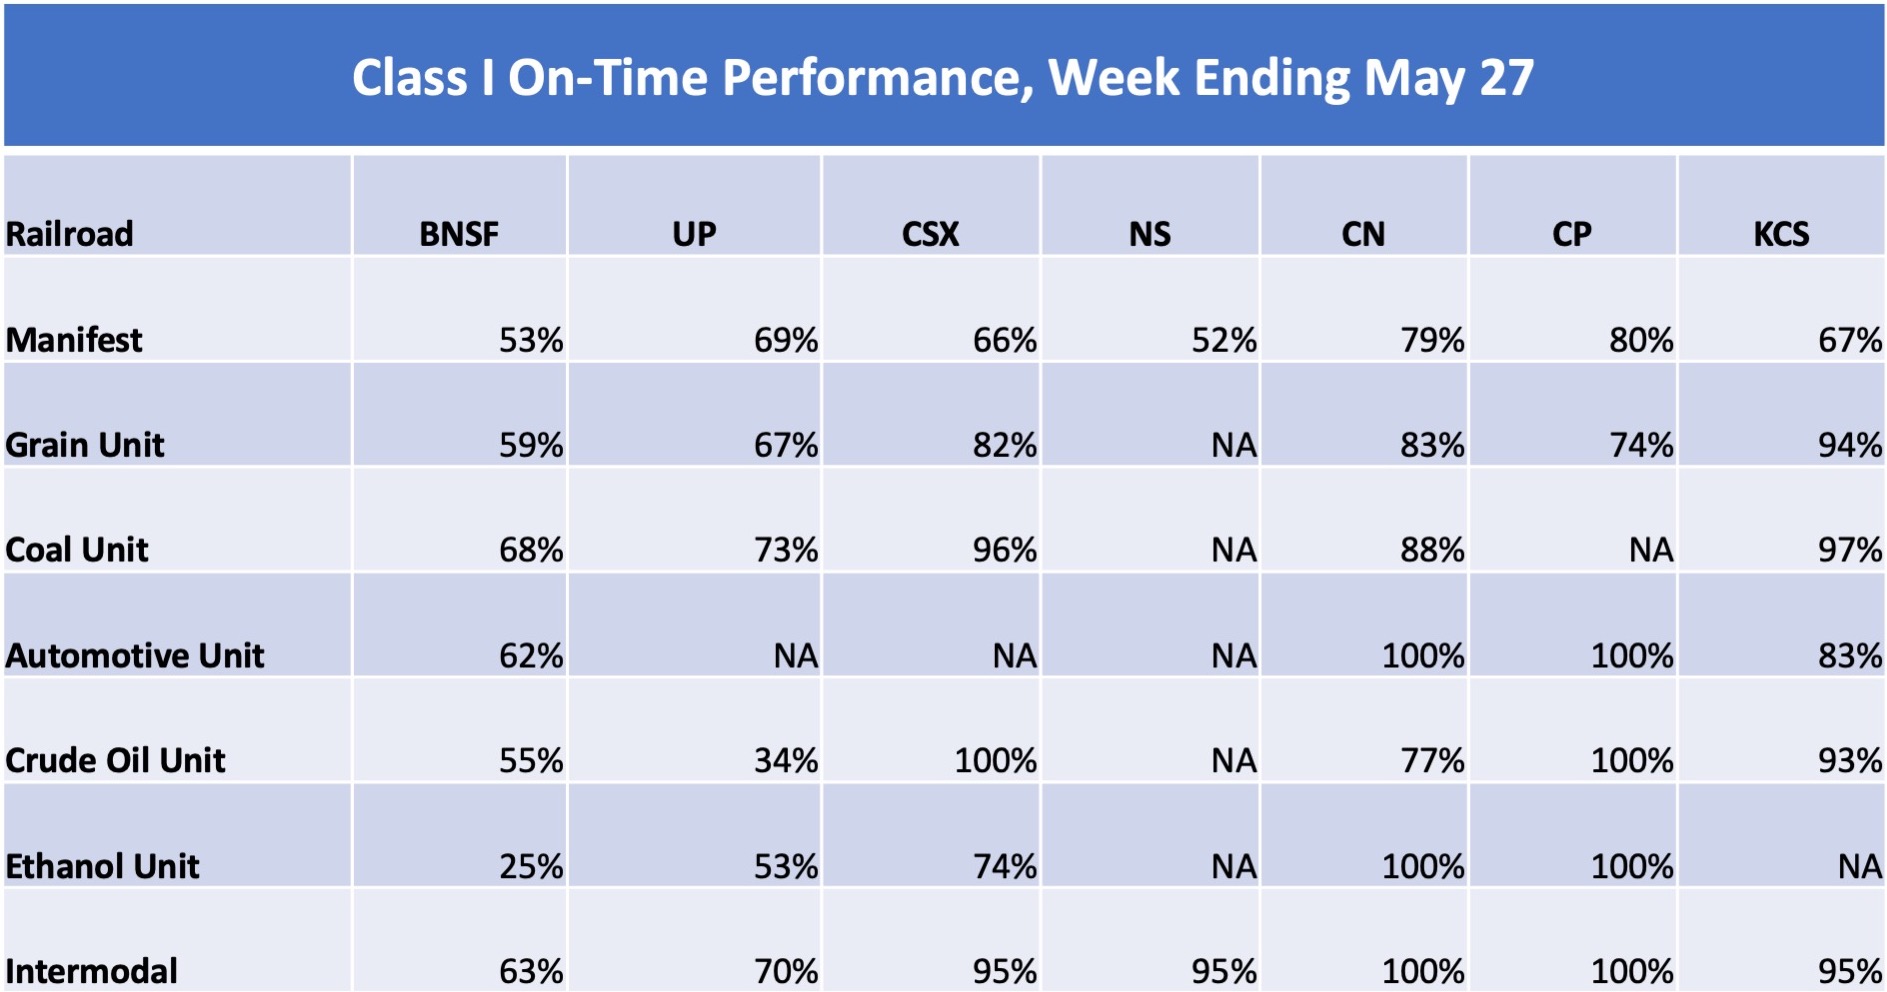
Overall on-time performance for the big four U.S. Class I railroads has fallen from a pre-pandemic average of 85% to just 67% in the last week of May 2022, as crew shortages continue to plague rail service.
The extent of the service decline was revealed in historic on-time performance data that BNSF Railway, CSX Transportation, Norfolk Southern, and Union Pacific submitted to the Surface Transportation Board last week.
The board last month mandated increased performance data reporting after shippers aired their complaints during two days of rail service hearings in April [See “Federal regulators order railroads to provide more service data …,” Trains News Wire, May 6, 2022]. The railroads began reporting the more detailed metrics in May, including providing federal regulators with on-time performance figures for the first time.
The STB defines on time as carloads and intermodal trains that arrive at their destinations within 24 hours of the original estimates provided to customers. The railroads’ internal trip-plan compliance figures generally are much tighter than what they are required to report to the board, however.
The historic data trail starts in May 2019, although the railroads provided different types of on-time performance information to the board. BNSF and NS provided an all-in number, for example, while CSX broke down its performance by manifest and intermodal traffic. UP provided carload figures beginning in May 2019, but its intermodal figures start in January 2021. UP also included a snapshot of the performance of its bulk trains.
The railroads have emphasized that the data should not be used to compare the Class I lines because of the different ways they collect information and calculate on-time performance and other key metrics, from average train speed to terminal dwell.
An analysis of the on-time performance figures — comparing each railroad’s May 2019-April 2020 average to its performance in the last week of May 2022 — shows wide differences between the big four systems.
UP showed a 7-point decline, with on-time arrivals dropping to 70% from 77%. That was the smallest drop among the big four systems, but UP’s May 2019-April 2020 average was the lowest reported, partly because it was weighted to manifest performance due to the lack of 2019 intermodal data.
CSX’s on-time performance went from 96% to 85%. Some 92% of carload traffic arrived on time in the 12 months ending in April 2020, while intermodal traffic was nearly 100% on time. Manifest traffic is currently 66% on time; intermodal is running 95% on time.
BNSF’s overall on-time performance tumbled 19 points, falling to 61% from 80%.
NS, which seems to have the most widespread crew shortages at key terminals, fell the most at a 35-point decline. NS reported 87% on-time performance for the 12 months ending in April 2020. That figure currently stands at 52%.
The on-time performance figures reflect the impact of crew shortages that have slowed each railroad. As their networks slow down, it has created congestion and higher recrew rates. And that means the railroads’ crew and locomotive needs only increase, which exacerbates the shortage of crews and not having power in the right places at the right times.
UP also submitted a revised service recovery plan that includes the railroad’s targets for improvements in key performance metrics as well as information regarding its fuel conservation programs. The STB had requested both in its initial order to the Class I railroads last month.
UP’s car velocity goal is between 205 and 210 miles per day, up from the current 188 miles.
UP has reached its goal for first and last mile service, which is 91% fulfillment of local service as scheduled.
UP’s trip plan compliance goal for manifest traffic, running at 69%, is within the target range of 66% to 73%.
The intermodal trip plan compliance goal is 76% to 83%. It currently stands at 70%. Bulk trains, at 72% on time performance, also fall short of the target range of 77% to 85%.
The board also asked the railroads to report whether they have any throttle setting, locomotive power, or train velocity restrictions currently in place — and to explain why. Various restrictions on train speed, along with low horsepower-per-ton ratios and use of energy management systems, were contributing factors to congestion, rail labor leaders claimed during the STB’s rail service hearings in April.
UP said it had no systemwide train velocity restrictions other than those required for safety based on track, train, or rolling stock characteristics.
“Union Pacific does maintain a restriction on locomotive throttle settings for certain trains operating more than 50 miles per hour,” the railroad told the board. “This throttle restriction applies to approximately 40% of Union Pacific trains. Moreover, it only limits the amount of locomotive power and inefficient fuel burn that may be used for trains operating above 50 miles per hour. To be clear, it does not necessarily limit affected trains to 50 miles per hour.”
The other three Class I railroads — Canadian National, Canadian Pacific, and Kansas City Southern — were not required to attend the STB’s rail service hearings or to submit service recovery plans. They still must report the expanded service metrics to federal regulators every week. Their reports cover only their U.S. operations.






So in 2022 Railroads are moving goods marginally faster than they did 100 years ago, and serving customers immeasurably less well. Some progress.
Looking at the various types of rail cargo delivered it appears that unit trains do well and everything else is all covered by manifest which has a terrible set of numbers. I have to wonder how the actual numbers were derived. Working for IBM we had a running joke for any numbers they provided for anything “We can give you any number you want because it is our numbers”.
I have to wonder what the real difference is for the customer when the railroad said it arrived and the customer says it’s late or never showed up.
180-230 mile per day average velocity? Most trucking companies are very unhappy when equipment is not averaging 400 miles a day.
I dont know why STB is so surprised by this. Companies were complaining about this issue at least 4 years ago or more. You really believe the numbers the Carriers are providing? Majority of CSX management are from CN. This is a goat rope.
Ah yes, but the top-end bonuses, stock options, and share values have grown exponentially with every decrease in the OR; that’s really what PSR is all about.
One of the arguments for megamergers was they were supposed to result in more efficient, seamless service.
Eight years ago I was tasked by my employer to shadow three of our locomotives from New Mexico to Colorado. (For the geographically challenged CO and NM share a common border.) Since Uncle Pete was the interchanging roads on both ends they handled the whole thing…via the scenic route of Texas, Oklahoma, Kansas, Nebraska and Wyoming before finally entering Colorado. It certainly was “seamless” and I had a great time doing my job and seeing the sights. Nevertheless, is such a service really in the national interest?
The goal for freight has always been “longer trains, faster trains, fewer trains.” They got the longer/fewer part courtesy of technology (Locotrol). The faster part will take a massive amount of infrastructure: longer sidings, double track, elimination of civil speed restrictions, etc. But that means spending money.
Boy how times dumb things down. 66% once was a flat out big F. And 73% was a D- . As far as service goes it’s still a failure either way. And I never hear the corporate big wigs taking responsibility for the fact that they created the crew shortages. And hey, NS, like to see your response to the energy management and low hp to ton ratio.
Even 40 years ago 66% was a solid D, heck it was like that in the 70’s 90-100 was in the A range, 80 – 89 was in the B range, 70 – 79 was in the C’s and a D was 60 – 69, anything 59 and below was failing. Don’t know how far back you’re going, but I’m only going back 40 – 50 years.
Let’s look at these metrics another way.
“UP’s trip plan compliance goal for manifest traffic, running at 69%, is within the target range of 66% to 73%.” Before grades were eliminated in school, a 66% was a “D”, while a 73% was a low “C”. Performing at a “D+” is OK at the corporate level. If the executive bonuses were based upon customer service, would this be acceptable?
As a manufacturer of goods, you now receive materials by boxcar twice per week. You used to receive boxcars four times per week. (BTW, you are now getting charged for excess cars dwelling in the system.) Your service has been cut in half. There is a 69% percent chance that a boxcar a needed material will show up at your factory. Factoring the reduction in service with the 69% service metric, there is a 34.5% chance of receiving your needed materials at the time you need them. You have two options. Increase the amount of stock on hand to even out the delivery irregularities or seek other modes of delivery. Either way, it is going to cost you more to manufacture your goods. Can you do it and remain competitive in the market?
Chris, there’s no cost to maintaining stock on hand anymore…that’s a fallacy. If I was running any type of manufacturing facility I’d keep a 6 months supply of materials on hand at all times.
How much warehouse space do you need to store six months worth of raw materials? How much money is sitting not earning anything. What is the cost of the warehouse and the taxes on the equipment.
“UP’s car velocity goal is between 205 and 210 miles per day, up from the current 188 miles.”
Remember how aghast you all were at CN reporting 240 miles per day in a May 18th article. And having seen most of both companies mainline infrastructure sort of speaks how bad UP is doing, or how good CN is doing.
Now, how about the other Class 1’s, especially the eastern two.