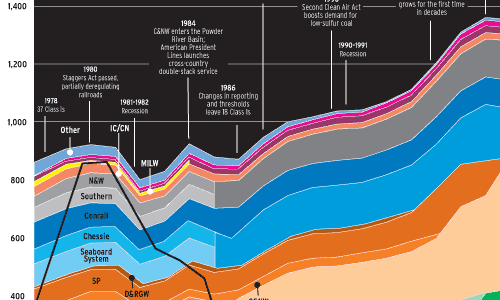
The undeniable triumph of U.S. railroading can be seen in this graph of revenue ton-miles: the most basic unit of measurement (hauling one ton of freight one mile) for the work railroads perform. The data for this illustration come from the Association of American Railroads, and are confined to Class I railroads, the largest group of railroads by revenue and mileage.
(The Surface Transportation Board and its predecessor, the Interstate Commerce Commission, established thresholds for what constitutes a Class I based on operating revenues. The threshold is adjusted each year for inflation.)
It took 24 years (1944-1968) for railroads to regain the volume of ton-miles they moved at the height of World War II. Yet in that same span, rail’s share of U.S. intercity freight traffic fell from 69 percent to 41 percent, as new highways and suburbs created a demand for shorter-haul moves that trucks easily captured. Between 1968 and 1978, as railroad ton-miles grew another 15 percent, their share of freight fell to 36 percent.
Given what preceded it, the 1978-2008 period shown here represents something remarkable. Deregulation gave railroads the ability to price traffic competitively, while mergers helped railroads economize, and enabled them to rationalize and upgrade the mainline network to handle volumes that would have been unthinkable years earlier. The boom in traffic came primarily from two sources: cross-country intermodal shipments and demand for low-sulfur coal from Wyoming’s Powder River Basin. (Intermodal loadings grew by a factor of four between 1980 and 2006.) Both commodities exploited what American railroads do best: carry huge volumes long distances. (The average length of haul for a train in 1980 was 616 miles. Today it’s 919 miles.)
In the past three decades, the actual tons originated by Class I railroads grew about 30 percent, while ton-miles have jumped a whopping 105 percent, reaching 1.8 trillion in 2008. All of this occurred even as the number of Class I route-miles shrunk 43 percent. (Today’s Class Is control two-thirds of the total U.S. rail network.) Where each Class I route-mile in 1980 carried 5.6 million revenue tons on average, in 2006 each route-mile handled 18.66 million tons. This growth enabled railroads to turn a corner in the mid-1990s and begin capturing more of the total U.S. freight ton-miles, after decades of losing market share to trucks.
Of course, the names have changed since 1978, and the number of Class Is has dropped from 37 to seven. That decline is a product both of mergers and reporting requirements. “If the definition of a Class I railroad in 1980 had been the same as it was in 2007, there would have been 26 Class I railroads in 1980,” the AAR notes. Recent acquisitions have actually brought the volumes from routes of smaller railroads like Delaware & Hudson and Bessemer & Lake Erie back into the Class I fold, decades after changing thresholds had dropped them from the list.
BNSF Railway is the ton-mile king, with 37 percent of the 2008 total. (BNSF’s ton-miles from coal alone exceed the total ton-miles moved by either CSX or Norfolk Southern.) Union Pacific is close behind, at 32 percent. CSX captured 14 percent, Norfolk Southern 11, Canadian National 3, Kansas City Southern 2, and Canadian Pacific 1 percent.


