Railroads & Locomotives Maps Railroad tonnage by state in 2004

Railroad tonnage by state in 2004

By Angela Cotey | March 24, 2010

| Last updated on March 17, 2021

Comparing where freight tonnage originates vs. where it terminates tells you a lot about the U.S.

Email Newsletter

Get the newest photos, videos, stories, and more from Trains.com brands. Sign-up for email today!

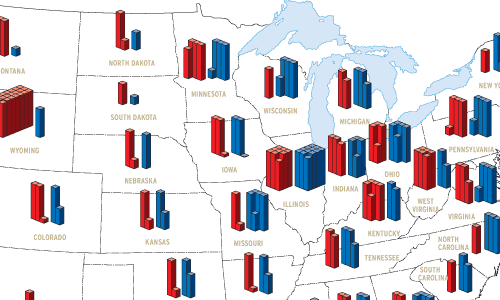
Railroad tonnage by state in 2004 map image

If you want to sense the impact of coal on the railroad industry, consider this: The state that ranks last in population — Wyoming, with a little more than 500,000 residents — originates one of every five tons of freight hauled by American railroads. The 419 million gross tons that began its journey in Wyoming in 2004 was more than double the next highest state, Illinois. And 95 percent of Wyoming’s tonnage comes from a narrow strip of land where mines are extracting Powder River Basin coal.

In fact, a broad conclusion that could be drawn from this map of U.S. rail tonnage in 2004 — a year when railroads hauled 2 billion tons of freight — is that originating rail traffic in the U.S. is tied to the location of natural resources, principally coal, whereas terminating traffic is tied to states with large populations.

Coal accounts for about 41 percent of the tonnage hauled by U.S. railroads, and 70 percent of that amount comes from three states: Wyoming, West Virginia, and Kentucky. So it’s no surprise that Illinois, West Virginia, Texas, and Kentucky fill out the top five originating states. With Wyoming, these states originate 45 percent of all U.S. railroad tonnage. (Texas, a non-coal producer, ranks first in origination of chemicals and petroleum products, and second in nonmetallic minerals and glass and stone products.)

Six states bordering the Ohio River account for 27 percent of all rail tonnage originated and terminated — Illinois, Ohio, Indiana, Pennsylvania, Kentucky, and West Virginia — owing in part to coalfields within their borders and rail-vessel transload facilities on the Ohio River and the Great Lakes.

The railroad’s ability to haul raw materials efficiently also explains why Minnesota’s 76.7 million originating tons is higher than the those of the grain-producing states surrounding it, thanks to Minnesota’s iron-ore deposits. Phosphate yields a similar effect in Florida.

States that lead in terminating tonnage are, in order: Illinois, Texas, Florida, California, and Ohio. This correlates somewhat to the population as a whole, since four of these states are among the five most populated in the U.S. (Ohio, the exception, ranks seventh.) California, with more than 36 million people, is tops.

The inset map [right] categorizes states as primarily originators (at least twice as much tonnage originated than terminated), terminators, or balanced regions. Wyoming and Montana have the highest ratio of originated-to-terminated tons (96 and 91 percent, respectively), while Arizona and Wisconsin have the highest ratio of terminated-to-originated tons (84 and 81 percent). Wisconsin’s imbalance can be attributed to the Port of Superior, where large quantities of taconite, grain, and Powder River Basin coal are transloaded to vessels for shipment in the lower Great Lakes, or in the case of grain, overseas.

Download the map
Success, start your free download!
Download the map PDF
You must login to submit a comment